In 1969 while I was at the Regina Campus of the University of Saskatchewan I wrote a term paper on how the Milankovitch climate cycles modulated the galactic climate cycles that produced
the great geological ages such as the Carbonaceous, Cretaceous, Pleistocene, Pliocene and our current Holocene.
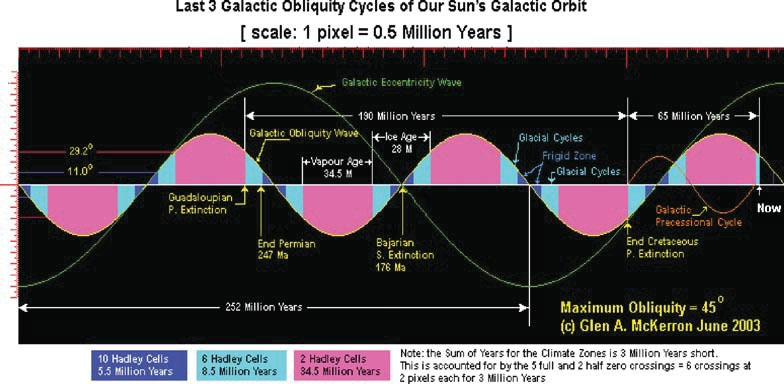
Included in the paper was a diagram I drew with the aid of a $125.00 Bamboo Manheim Slide Rule and a set
of colored pencile crayons. It shows the complete Galactic cycle set of curves (252 Million year Eccentricity cycles, 126 Million year Obliquity cycles, and 63 Million year Precessional cycles) and how each Vapour age is
followed by a True Ice Age.
It also shows how each true ice age goes through three stages: a leading 8.5 Million year Glaciating stage controlled by Milankovitch Obliquity Cycles, an 11 Million year central deep freeze
covering the complete globe including the equator in miles thick ice when the undersea volcanoes are completely dormant, and a trailing 8.5 Million year Glaciating stage controlled again by Milankovitch Obliquity cycles with
restored undersea volcanic activity.
Please note the glacial advances in the Glaciating stage only cover 2/3 of the globe in ice, never the whole globe as in the central deep freeze. The diagram also shows how the
beginning of each true ice age is associated with a major extinction event.
Only one Galactic Pressional Cycle is shown towards the right to make room for all the diagram's lables. Note how a single positive or single negative lobe of this cycle will just occupy
the same time span as either a Vapour Age or a True Ice Age. Any discrepancy between this observation and my text is due to the fact the thickness of the curve occupies 1000 years as it crosses the curve's X axis.
Below is a digital copy of this diagram I prepared for my book.
This paper attracted the attention of a group of advanced students who were interest in Milankovitch's work.
Thus in 1970, Dr. Darcy McNikle, the Chairman of the university's Anthropology Department asked me if I would be interested in colaborating with the group of Hays, Imbrie and Shakleton.
John Imbrie brought me an unabridged copy of the seabed data and a copy of the Vostock ice core data in plot form. He wanted to know if it was possible to properly merge the 2.5 million year
seabed plot with the Vostock plot of the last 650 thousand years,- as the ice core plot had a finer horizontal resoloution.
This involved locating the climate cycle on the seabed plot that corresponded with the left-most climate cycle of the Vostock plot. This could not be accomplished without first finding
the zero temperature baseline in both plots. We agreed to keep the replaced portion of the seabed plot for the benefit of those who wished to review our work.
John D Hays went on to become a professor of Geology at Columbia University in New York. John Imbrie went on to become a professor of Oceanography at Brown University in Providence, Rhode Island,
and Nickolas J Shakleton went on to become Professor Sir Nickolas J. Shakleton at the sub department of Quaternary Research at Cambridge University, Cambridge, England.